Platform Overview
PlatOps AI can be accessed through our web-based interface or through Slack.
This guide provides a comprehensive overview of the platform's features and functionality to help you get started.
Platform Web App
Go to PlatOps Platform to access the platform.
You will be greeted with the chat homepage:
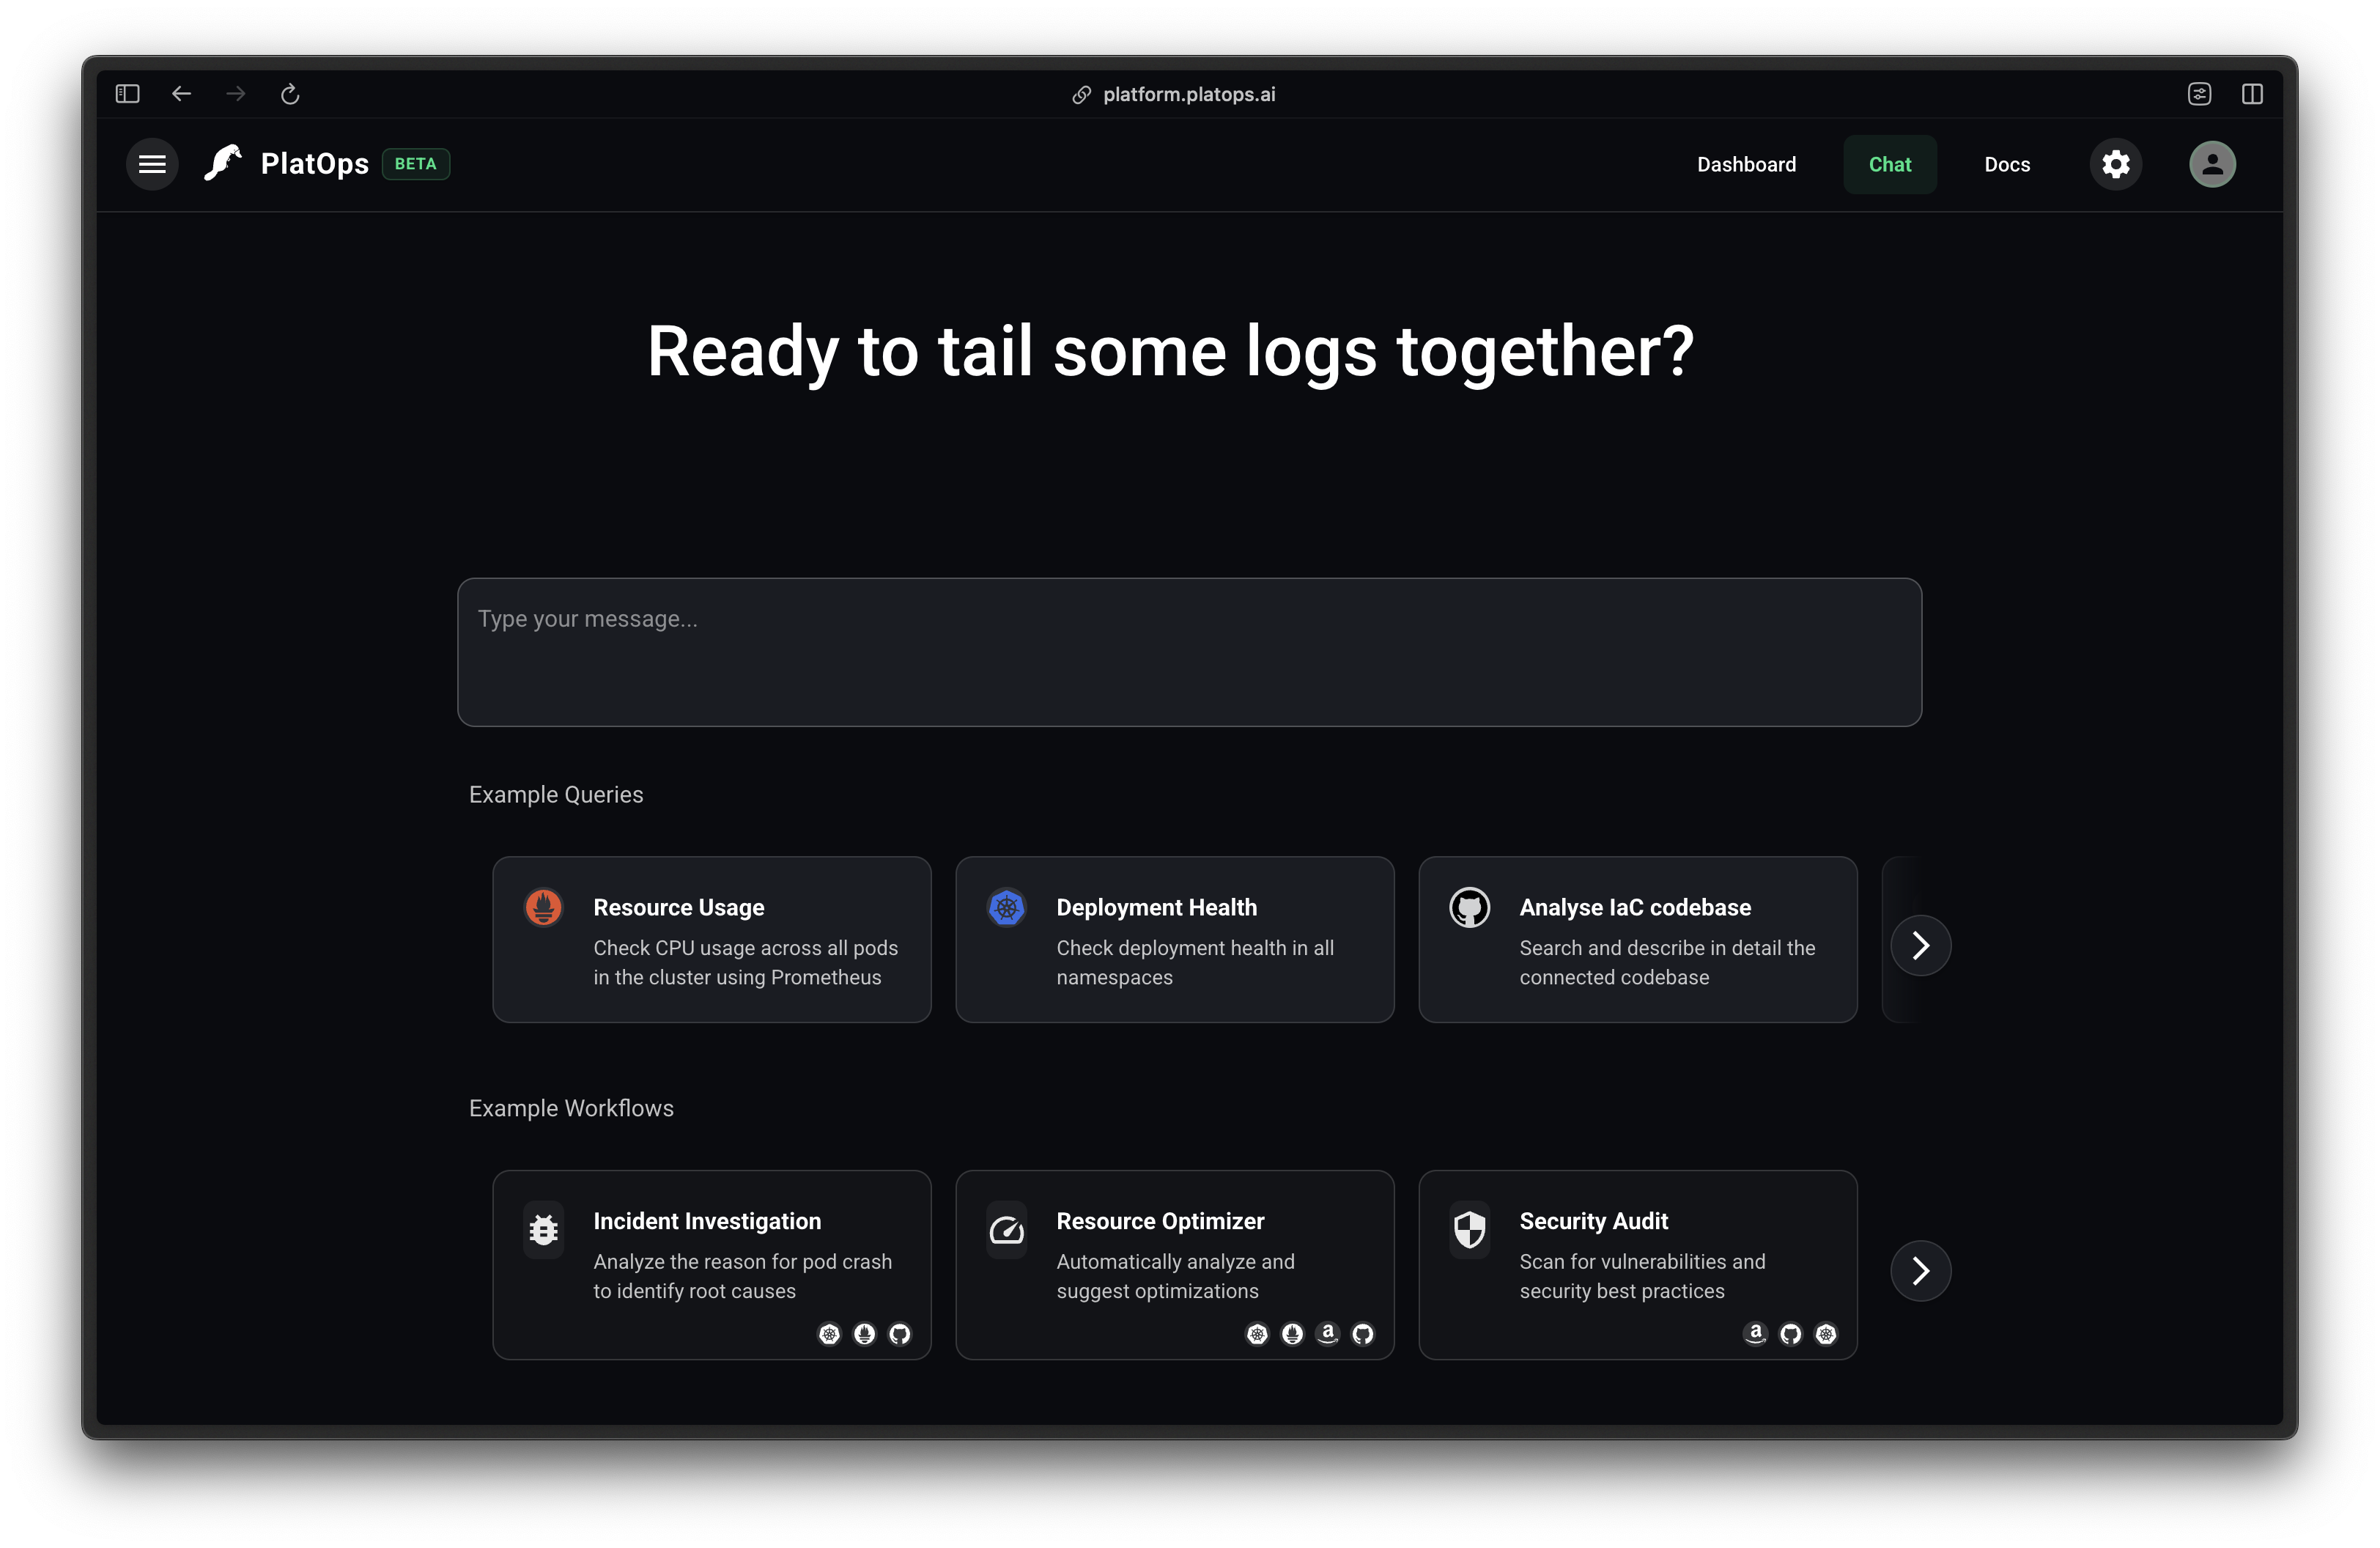
Chat Interface
The chat interface is your primary way to interact with PlatOps AI. Here you can:
- Ask questions about your infrastructure in natural language
- Request log analysis and troubleshooting assistance
- Run queries against your connected systems
- Execute predefined workflows
Example Queries
The platform provides example queries to help you get started quickly:
- Use resource monitoring queries to check system performance
- Verify deployment health across your environments
- Analyze your Infrastructure as Code for best practices and potential issues
Example Workflows
Save time with predefined workflows for common operational tasks:
- Incident investigation to quickly identify root causes
- Resource optimization to improve efficiency and reduce costs
- Security audits to maintain compliance and protect your infrastructure
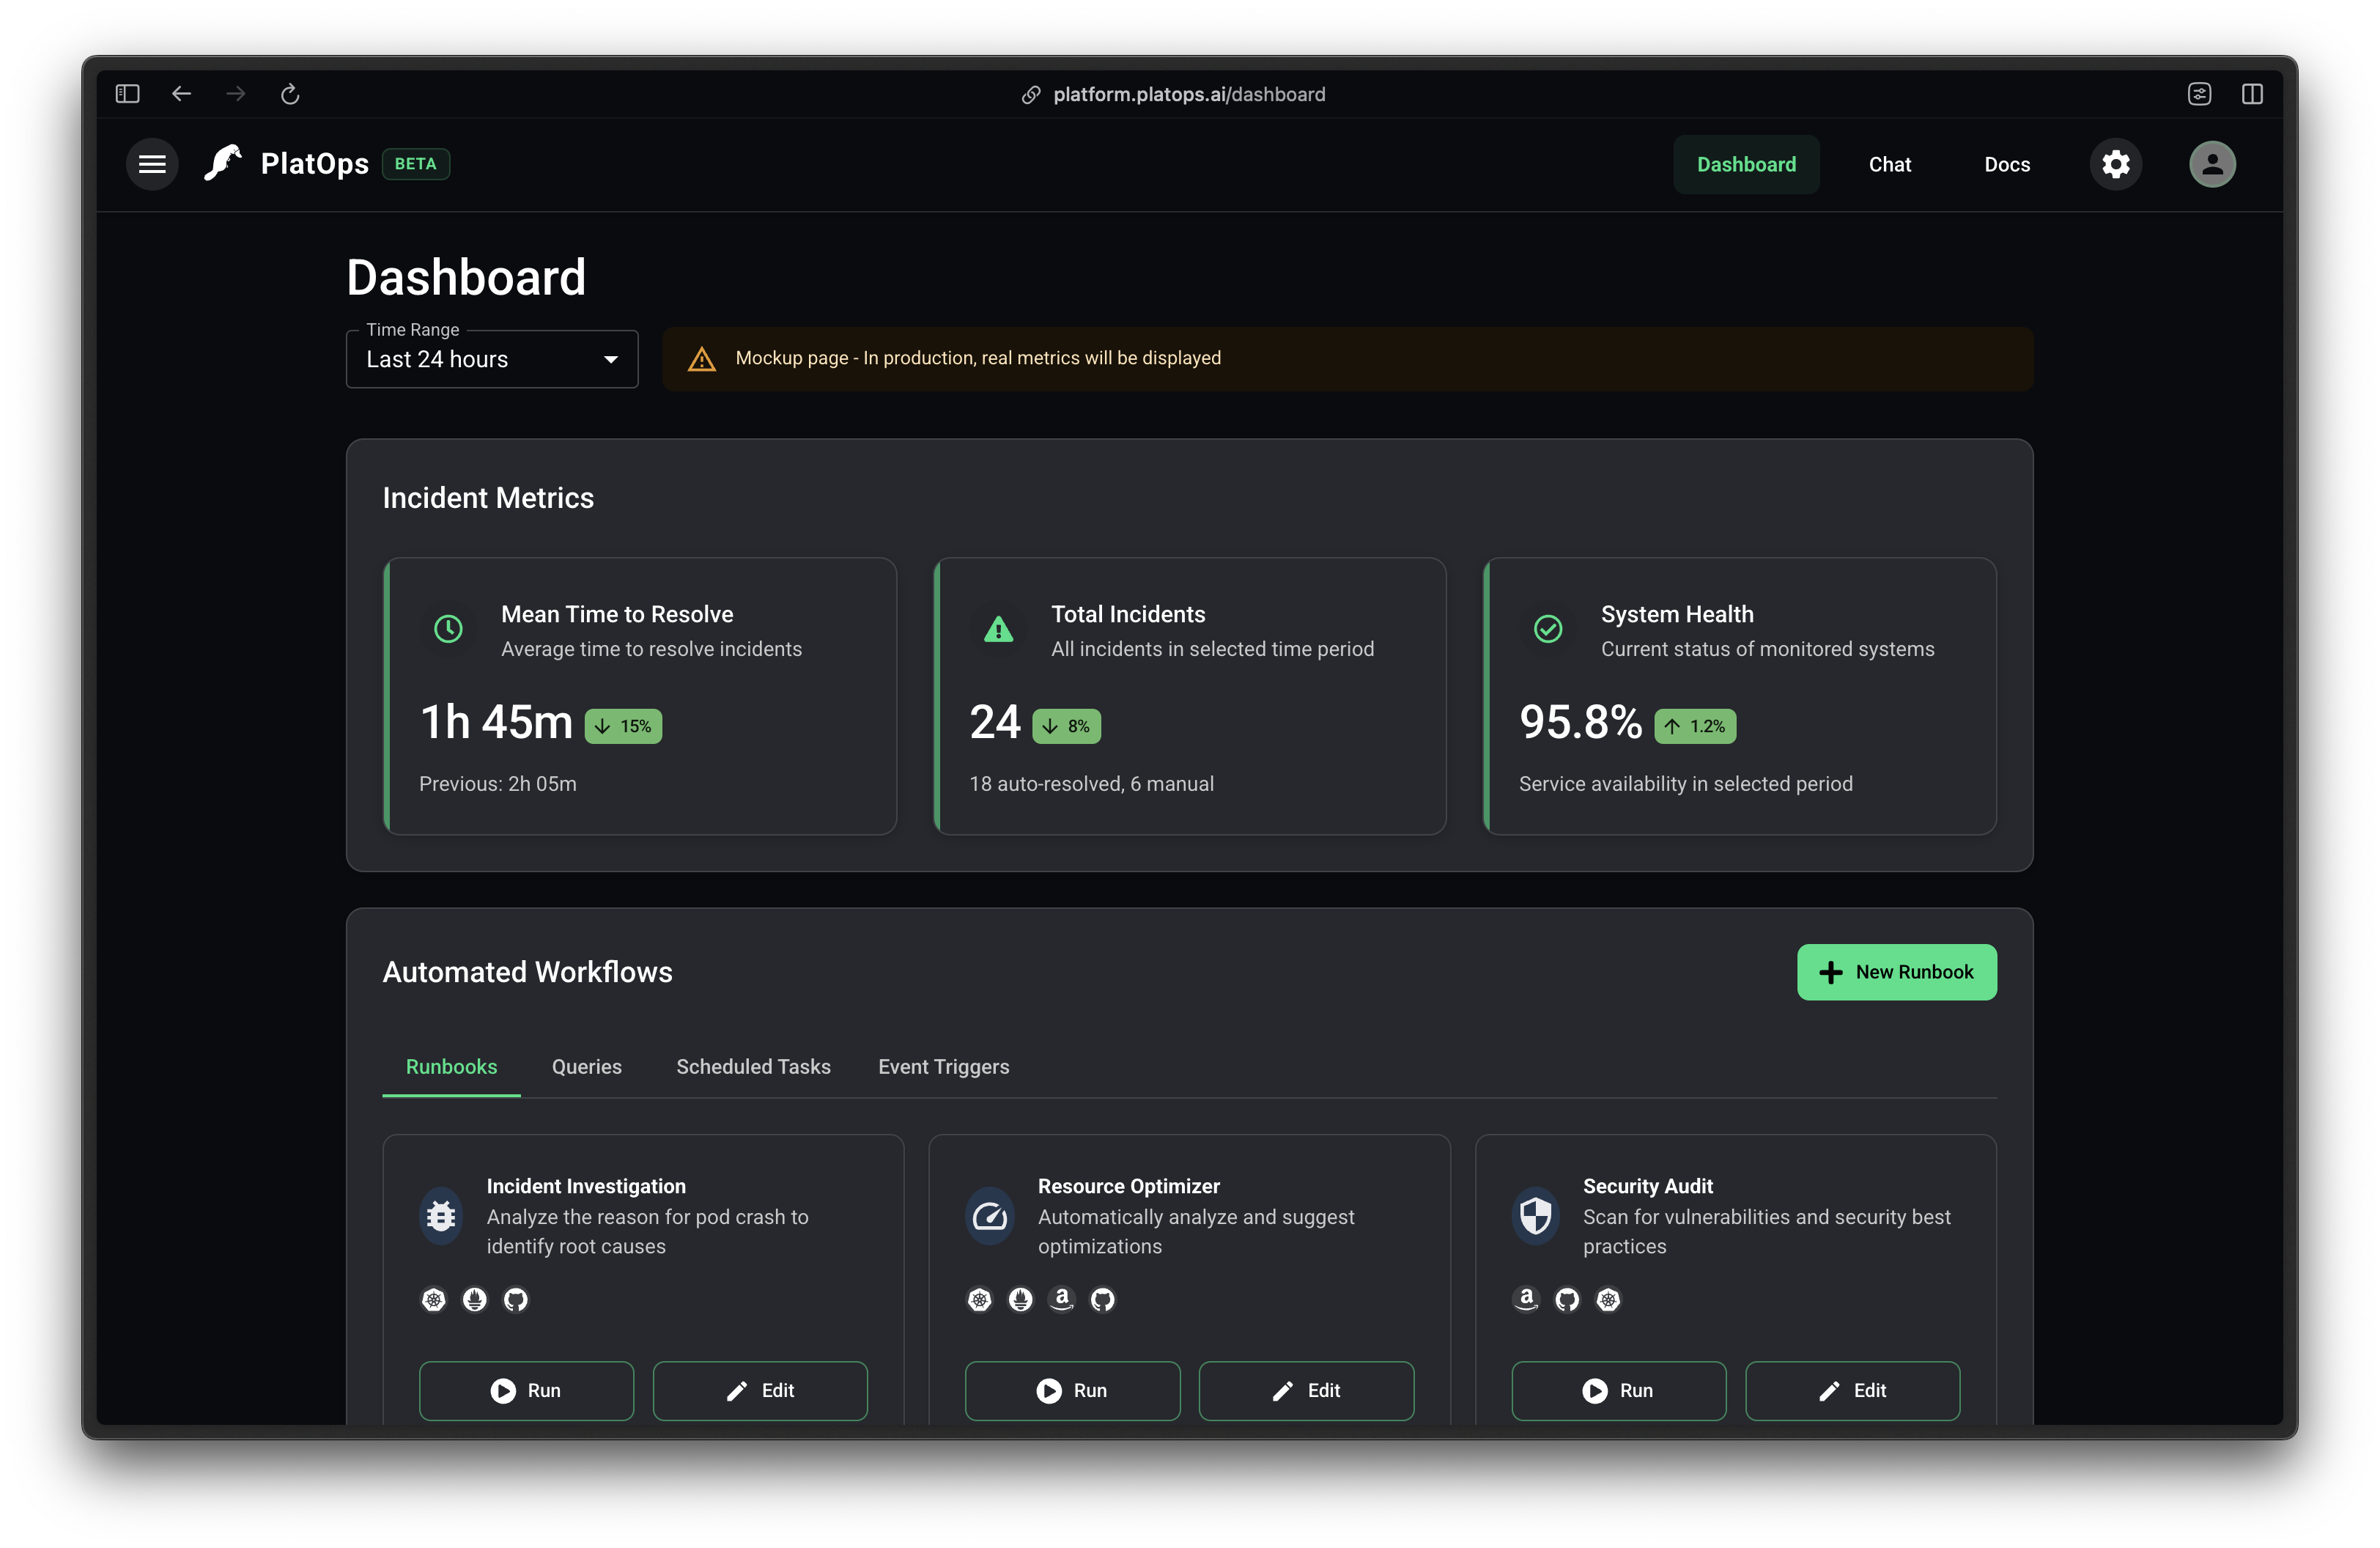
Dashboard screen
WARNING
The Dashboard is currently in development and will be updated in the future.
The Dashboard provides visibility into your infrastructure health and performance metrics.
Here you can:
- Monitor the overall health of your systems
- Track key metrics like Mean Time To Resolution (MTTR)
- View incident summaries and trends
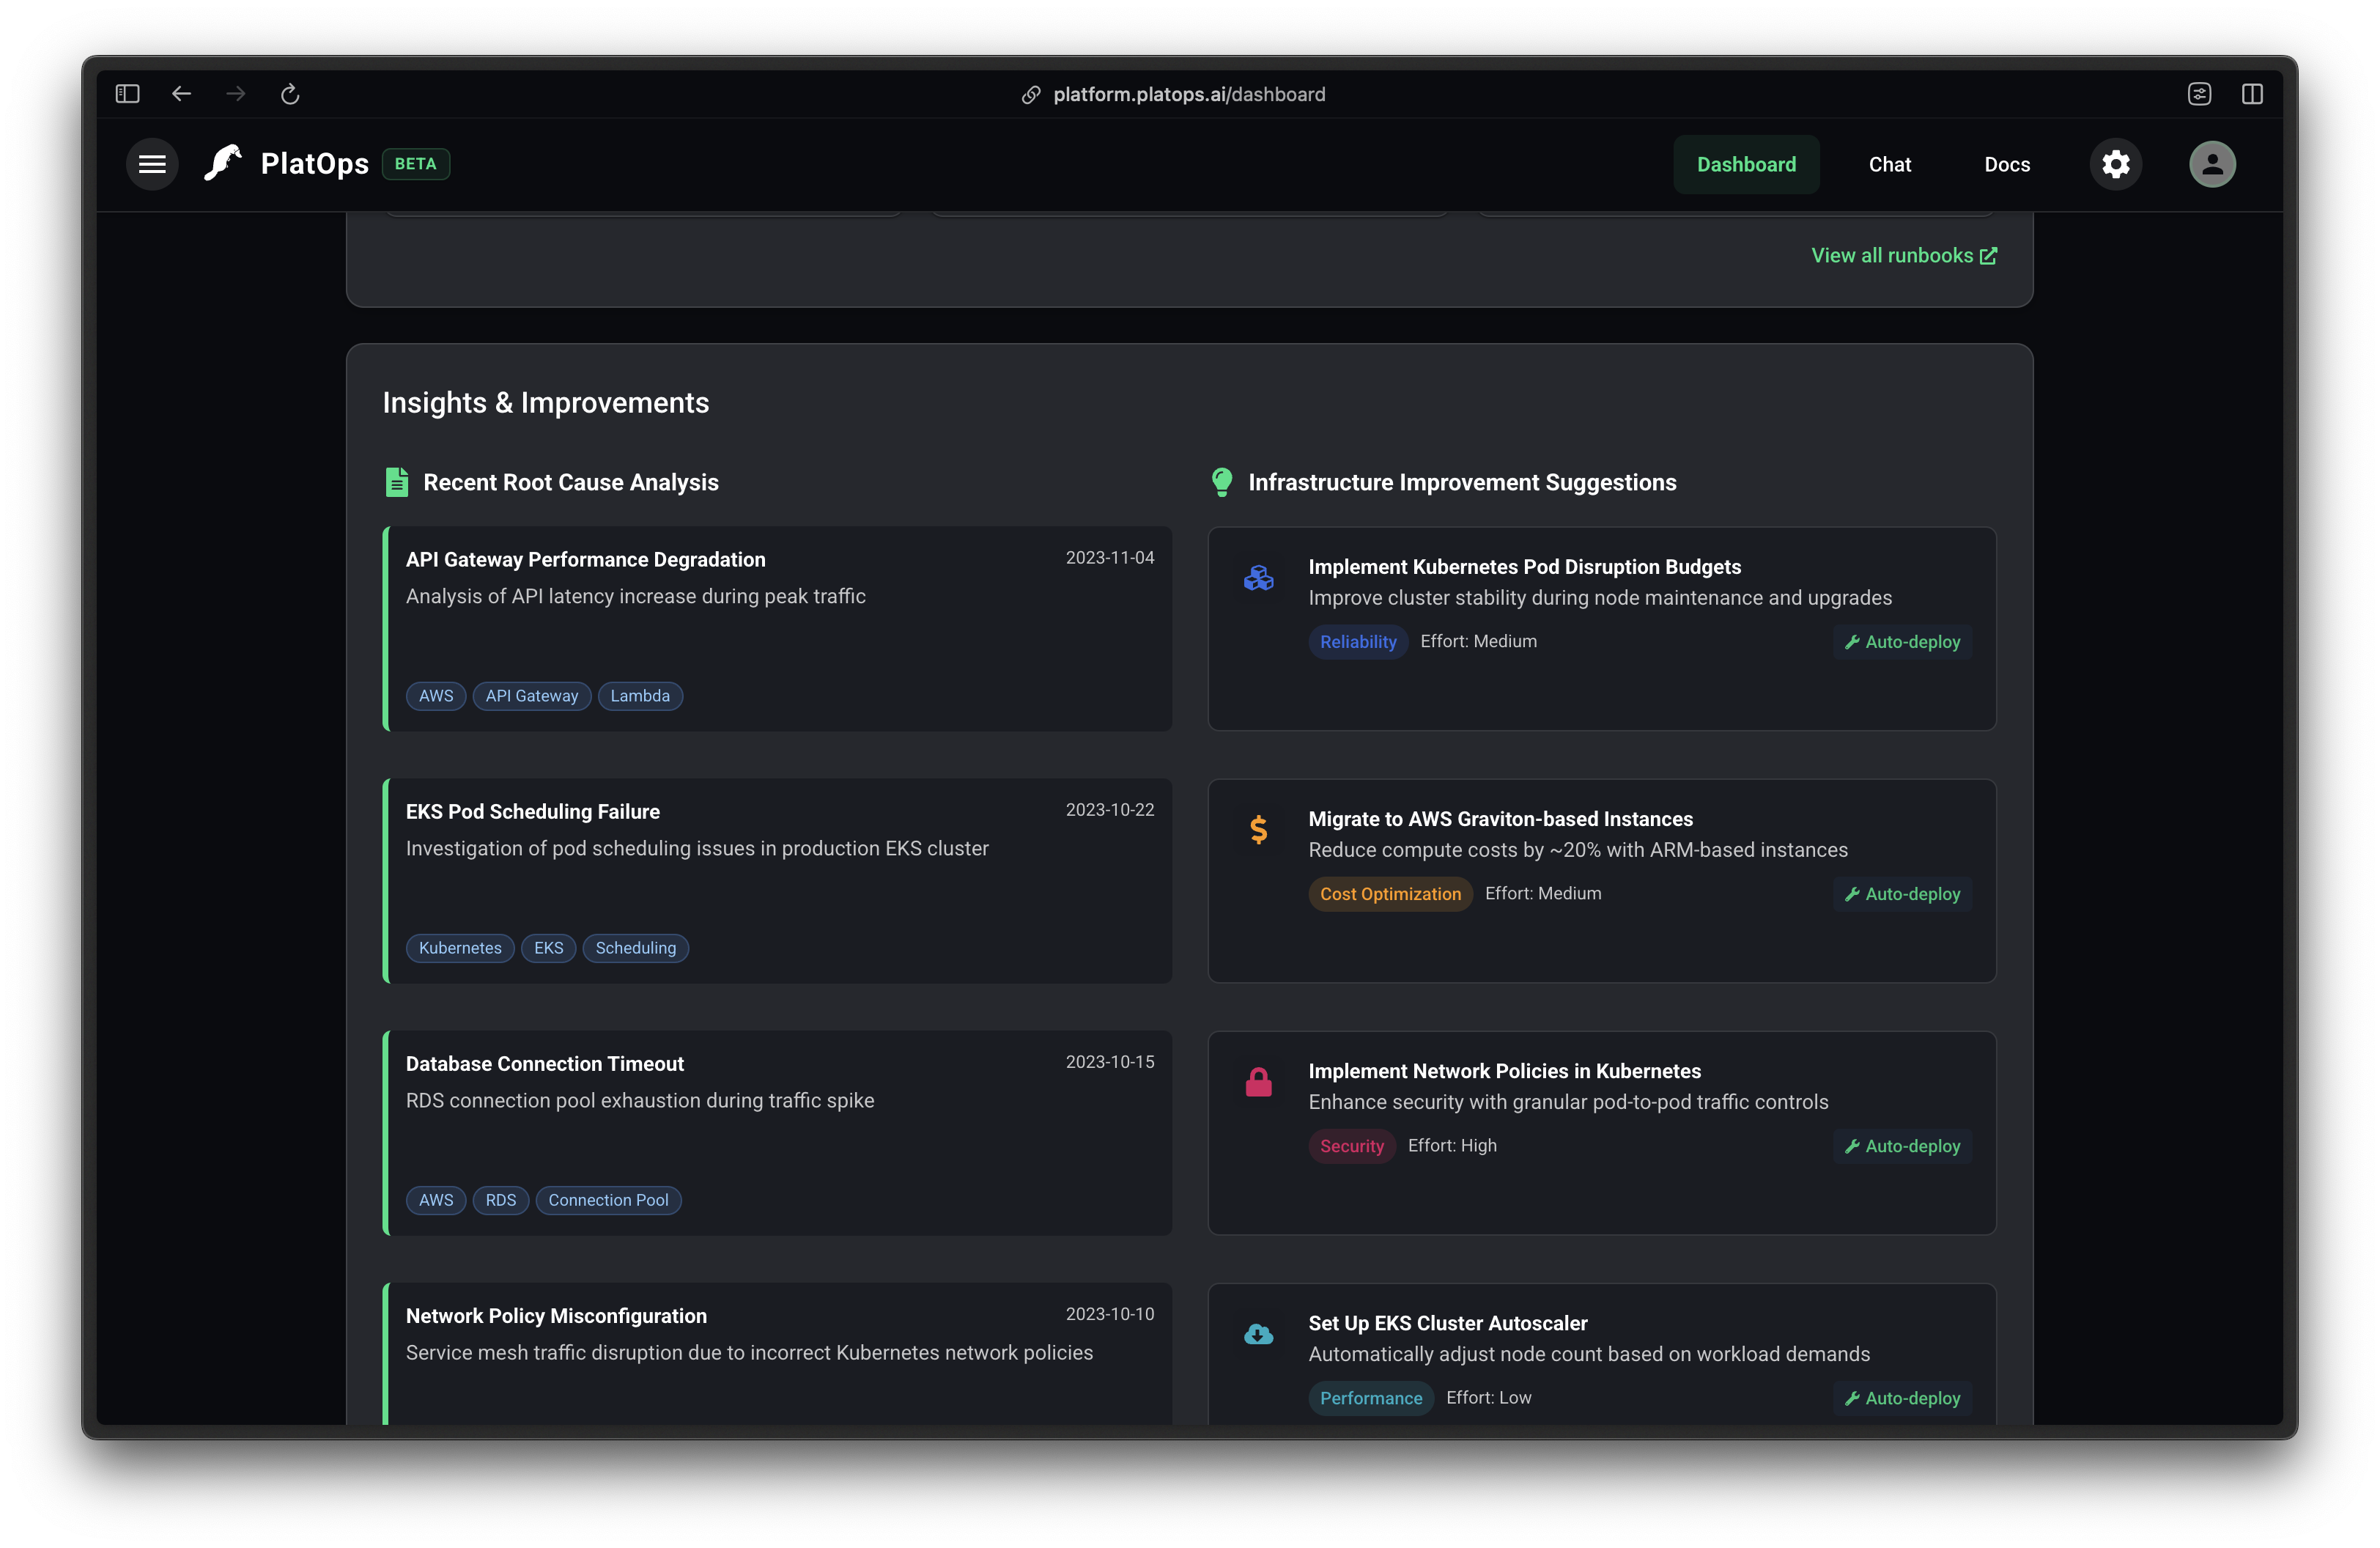
- Configure workflows for the AI
- Find suggestion for improving your infrastructure reliability and security
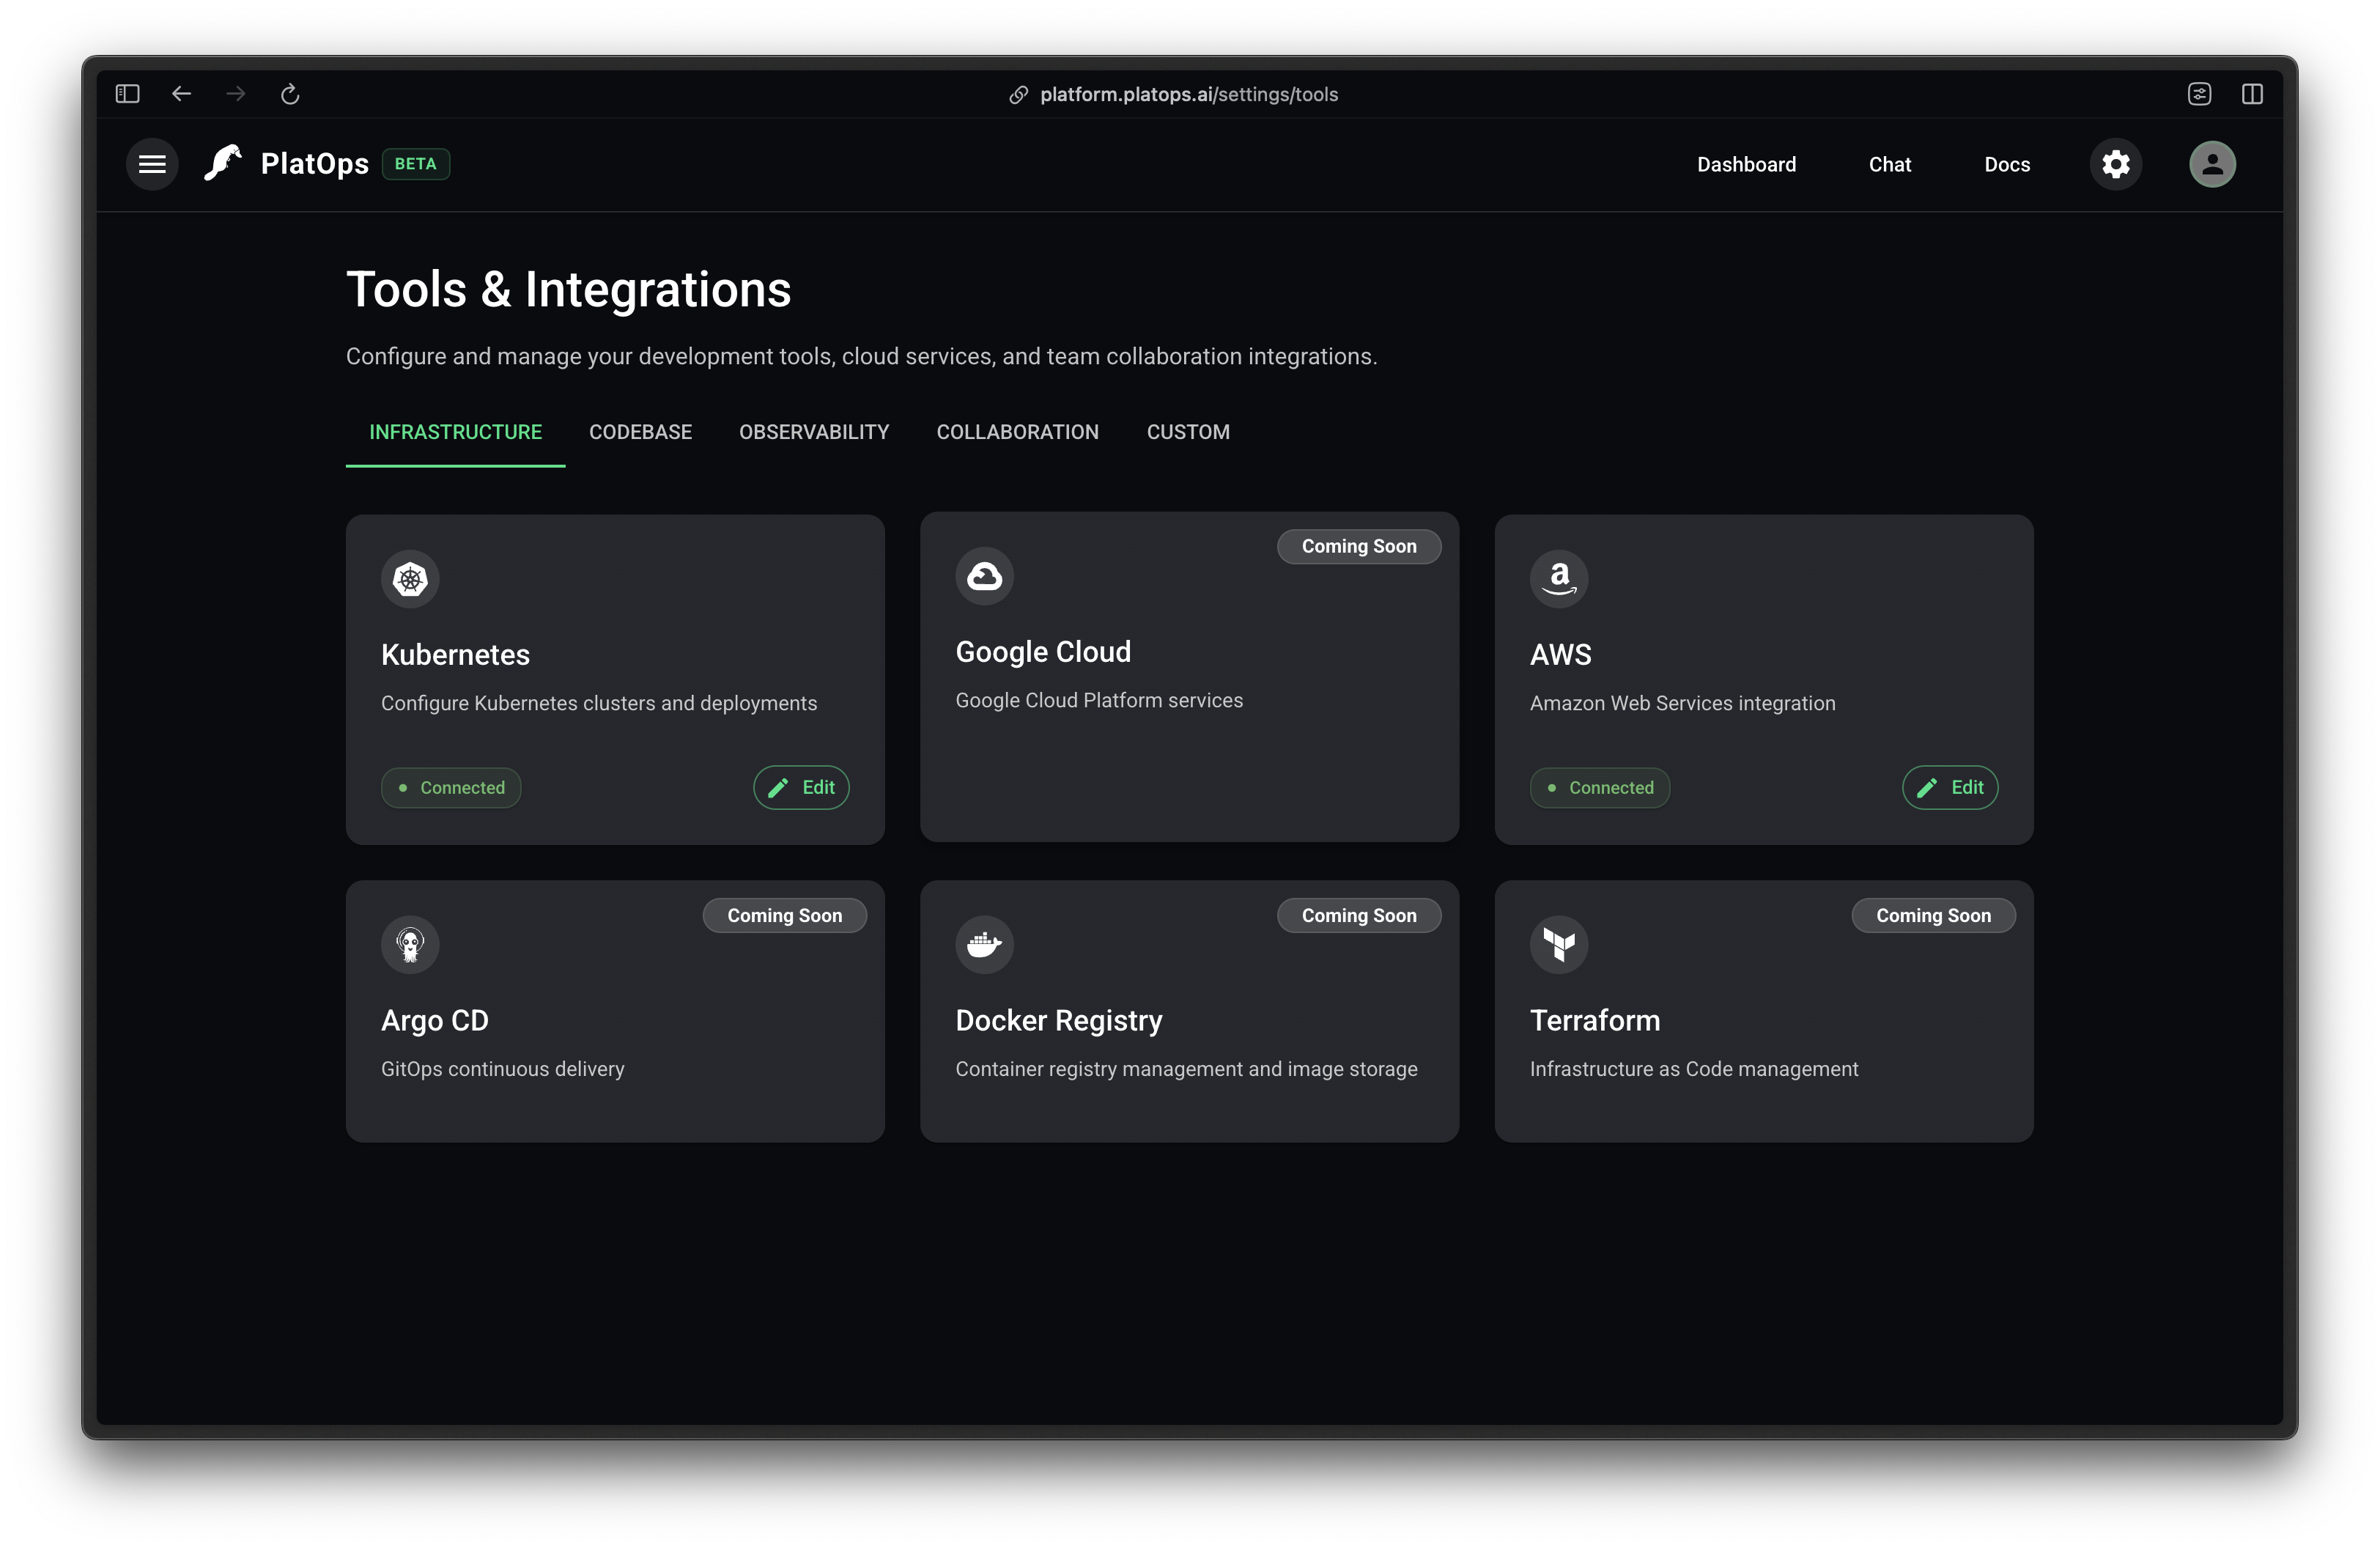
Settings screen
Here you can manage your account or configure your tools and integrations.
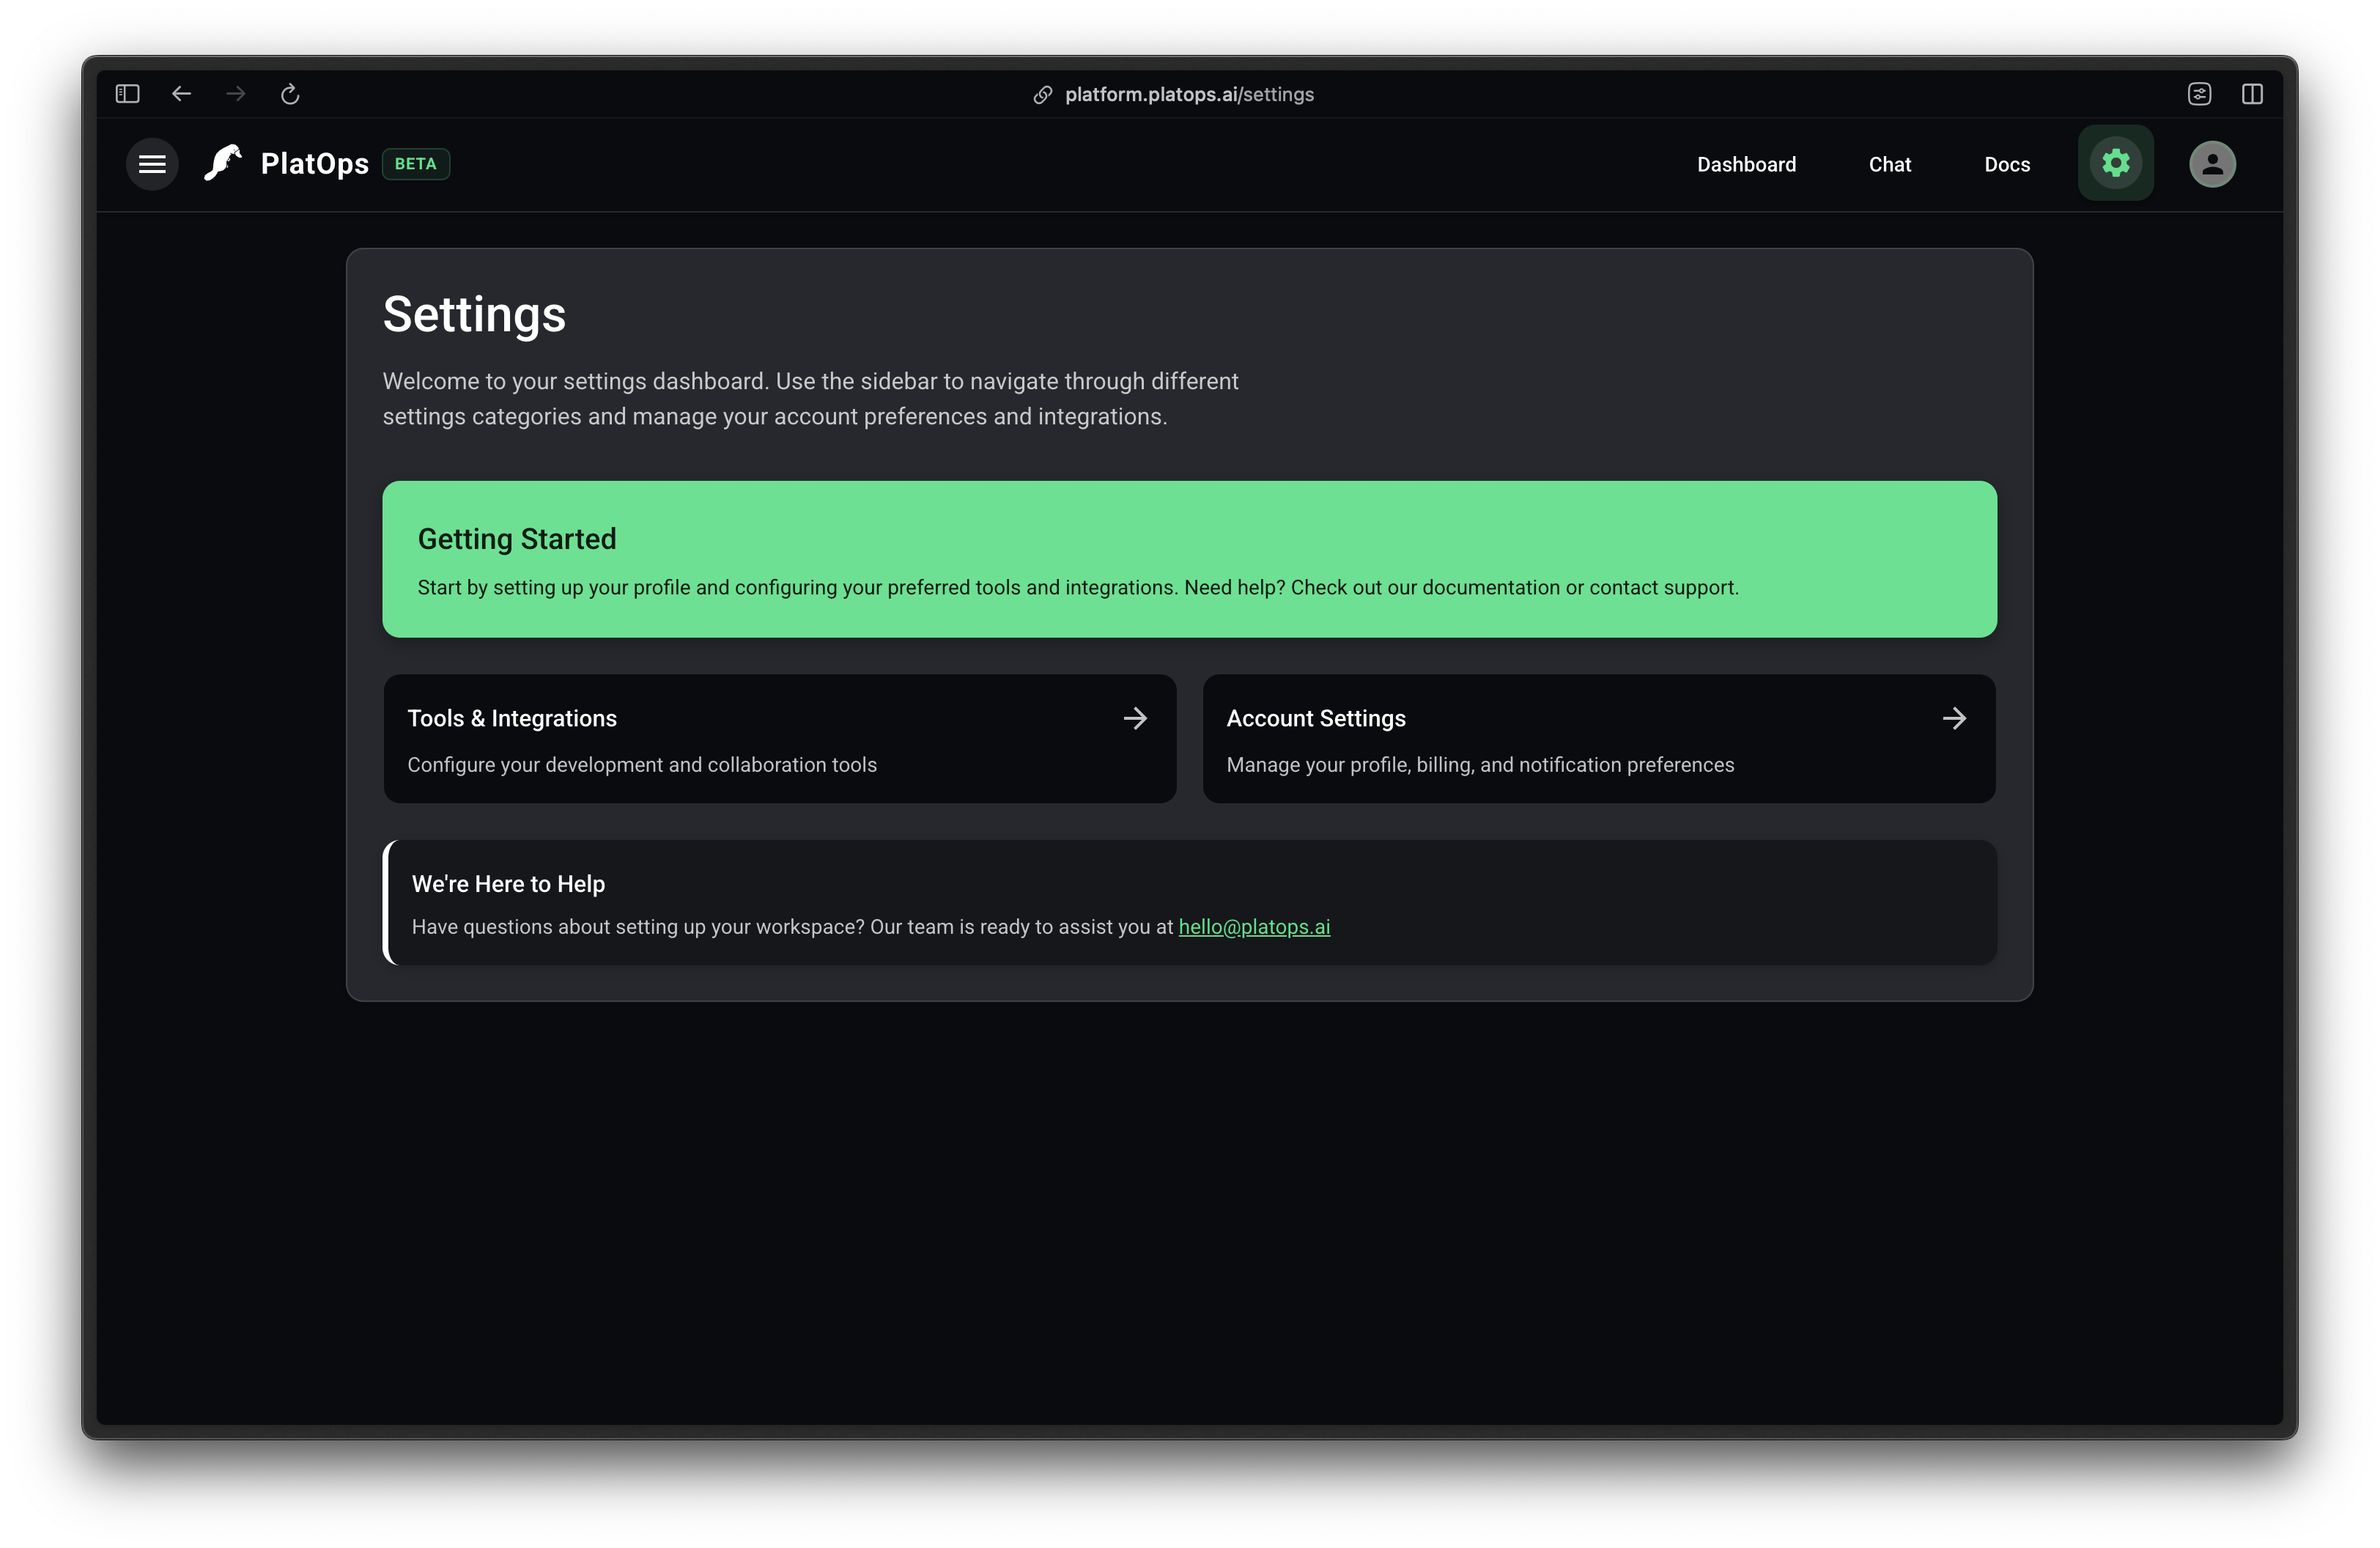
- Tools - here you can configure your tools and integrations.
We will cover how to configure and use tools in more detail in the Integrations section.